
XAU/USD Gold Technical Analysis - 19 Feb 2026
XAU/USD Gold Technical Analysis 19 Feb 2026 by Forex Trading Mentor Prasad Kadri. Get latest key levels, XAUUSD up wards taking support $4850 to $5000, indicators , trends & trading strategies for profitable gold trading.
XAU/USD Gold Technical Analysis
XAU/USD Gold Technical Analysis - Gold moves up wards from $4850 to Ressistance $5000 and next to $5040 as of 19 February 2026, after high volatility from yesterdays low $4850. Recent analysis highlights key levels amid ongoing fluctuations influenced by economic data and geopolitics.
XAU/USD Gold Technical Analysis Updates
Current Price/Range: ~$4850 -$5000 (Feb 19)
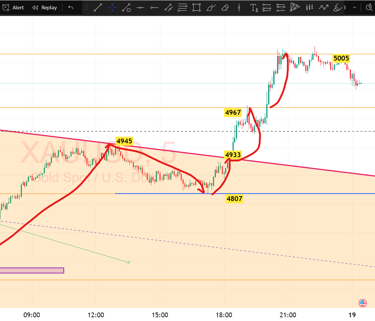
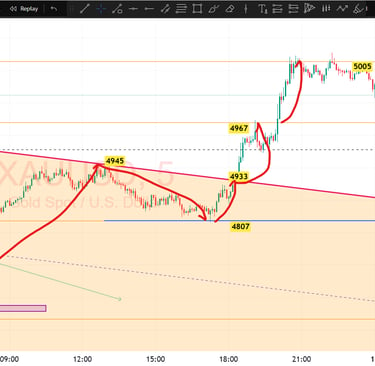
XAUUSD Support 01 - $4,967
XAUUSD Support 02 - $4,907
XAUUSD Support 03 - $4,850
---------------------------
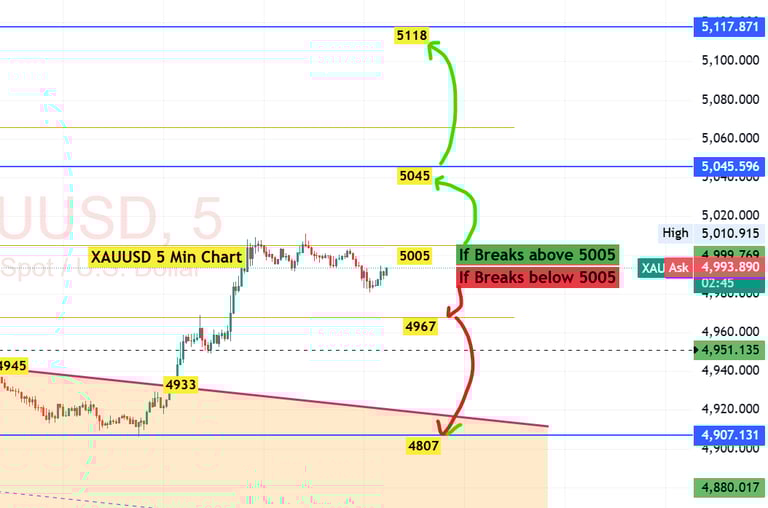
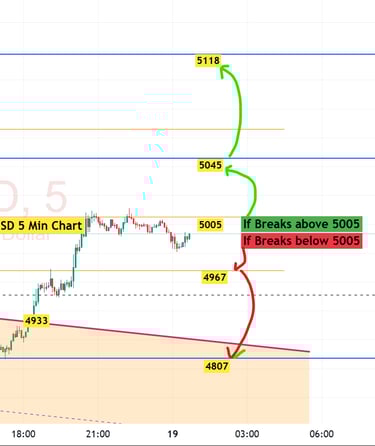
XAUUSD Resistance 01 - $ 5040
XAUUSD Resistance 02 - $ 5065
XAUUSD Resistance 03 - $ 5118
XAUUSD Support and Resistance Levels (19 Feb 2026 Gold Price Forecast)
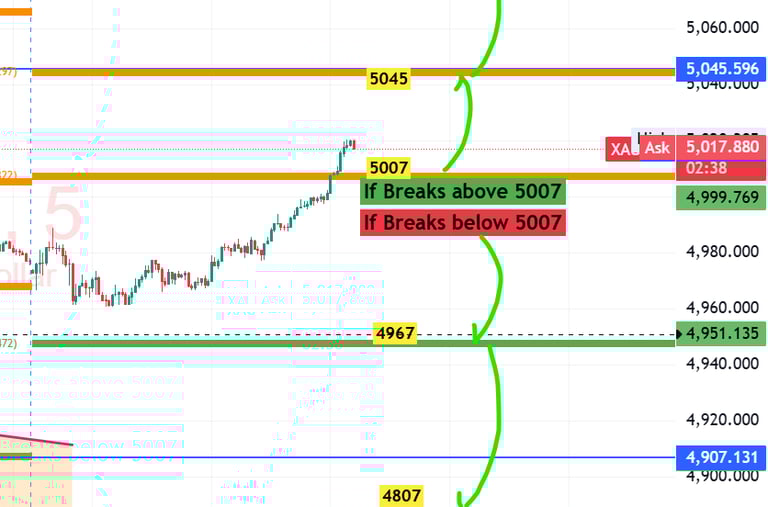
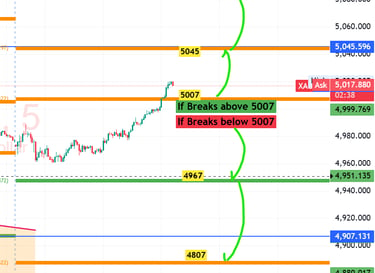
Key XAUUSD $ 5040 support level is broken $4967, second at $4,907, and third at $4,850—these are crucial gold price support levels for 19 Feb 2026 trading session.
On the upside, XAUUSD resistance levels start at $5040 (R1), $5,065 (R2), and $5,118 (R3), making them vital XAUUSD key levels 19 Feb 2026 for potential breakouts or reversals.
Traders, watch these XAUUSD intraday support resistance levels closely!
XAU/USD Gold Fundamental Analysis
Interest Rates/Debt: US sovereign debt crisis may force Fed easing (lower rates/printing), bullish for gold as fiat confidence drops.
Inflation/Geopolitics: High volatility from tensions; inflation expectations support hedging demand.
Central Banks/Economy: Dovish Fed pivot, weak USD below 101.5 could push prices higher; key catalysts ahead.
Gold Forecast - Sentiment
XAU/USD has followed a trend line support since September. It recently hit new record highs above $5,500, then plunged to $4,400 before stabilizing.
The pair now trades near $5,000, staying above $4,800. That's the 61.8% Fibonacci retracement level from the 2026 upswing.
Could it continue its long-term uptrend? Holding above $5,000 might lead to $5,245 and a retest of highs.
But if sellers take over and it consistently drops below $5,000, it could retest the trend line—or even fall back to $4,400.
गोल्ड फोरकास्ट - सेंटिमेंट
XAU/USD ने सितंबर से ट्रेंड लाइन सपोर्ट का पालन किया है। हाल ही में यह $5,500 से ऊपर नए रिकॉर्ड हाई पर पहुँचा, फिर $4,400 तक गिरा और स्थिर हुआ।
अब यह $5,000 के पास ट्रेड कर रहा है, $4,800 से ऊपर टिका हुआ। यह 2026 के अपस्विंग का 61.8% फिबोनाची रिट्रेसमेंट लेवल है।
क्या यह लॉन्ग-टर्म अपट्रेंड जारी रखेगा? $5,000 से ऊपर बने रहने पर $5,245 तक जा सकता है और हाई की रीटेस्ट हो सकती है।
लेकिन अगर सेलर्स कंट्रोल में आ जाएँ और यह लगातार $5,000 से नीचे चला जाए, तो ट्रेंड लाइन की रीटेस्ट हो सकती है—या फिर $4,400 तक गहरा गिरावट।
Trading Strategies Updates
Scalping/Day/Swing: Use liquidity sweeps, fake breakouts; buy lows in uptrend post-sweeps (50% retrace targets); top-down analysis with order blocks.
Bias/Invalidation: Bullish above key supports (no close below range); bearish below resistances; mechanical entries on pullbacks.
Risk Focus: Volatility high post-January reversal; position size near levels like $4,820/$4,530/.
Note : To learn about Forex trading you need to ensure you learn from a Forex trading Teacher in India . We also Provide Forex Fund Management Services in India
Expert SEO and website design solutions offered.
Contact
Support
Contact@Prasadkadri.com
+91 7259693333
© 2025. All rights reserved.